CSIRO Marine Labratories Report 221
Quality Control Cookbook for XBT Data*
(* Expendable Bathythermograph Data)
Version 1.1
R. Bailey, A. Gronell, H. Phillips, E. Tanner, and G.Meyers
Quality Control Cookbook for XBT Data*
(* Expendable Bathythermograph Data)
Version 1.1
R. Bailey, A. Gronell, H. Phillips, E. Tanner, and G.Meyers

Table of Contents
Temperature structure in the oceans
Overview of quality control procedures
References and acknowledgements
AbstractExpendable Bathythermographs (XBTs) have been used for many years by oceanographers to measure the temperature of the upper ocean. These instruments are simple devices which are designed to be deployed from moving vessels, enabling broad scale coverage of the world's oceans. The XBT has accordingly played an important role in several large international research programs, and the global data archives reflect this. Quality Control (QC) procedures are described for data recorded by XBTs. Examples are shown and described for commonly observed oceanographic features and instrument malfunctions. A QC code (flagging) system is described, which aids in the process of future validation and documentation of real features, and in the elimination of erroneous temperature profiles. There are some modes of malfunction of the XBT which appear very similar to real oceanographic features. This "Cookbook" enables the user to better distinguish between the two. A knowledge of the different types of real and erroneous features, when combined with a local knowledge of water mass structure, statistics of data anomalies, the depth and gradient of the thermocline, and cross validation with climatological data in a statiscal sense, ensures a data set of the best possible quality.
The Quality Control (QC) procedures described here have been developed by oceanographers participating in the CSIRO XBT Program, specifically to assure the research quality of expendable bathythermograph (XBT) data of 0.6 to 2.0 m resolution, at the delayed mode stage. This manual provides an overview of real oceanographic features and instrument errors that have been monitored over a period of years and from which the CSIRO procedures and QC codes (flags) have been developed. An example of each flag is provided to illustrate the subtle differences in structure that occur when either an error or feature is recorded in the XBT profile data. We believe that checking XBT data for the occurrence of these errors and features, combined with comparisons to climatological data and to neighbouring profile data, forms the basis of scientific quality control.
The ability to judge whether a feature is realistic for a particular region cannot easily be passed on to a QC operator from a manual such as this. Local knowledge of water mass structure, statistics of data anomalies, the depth and gradient of the thermocline, as well as reference material from atlas data must be incorporated into the validation process. These ingredients all help to establish if the specific event (e.g., an inversion) identified in the profile is probable or not for the region in which it was observed.
The potential types of malfunctions of the XBT instrument must also be kept in mind when performing QC. If uncertain, the QC operator should proceed with caution whilst ensuring that no good data is thrown away. The type of flag to assign under these circumstances will depend on the type of error or feature, and the appropriate action to take will become clearer as each flag is discussed in detail. This "cookbook" is intended to make the identification of real and erroneous features easier. It must be kept in mind, however, that the ability to make valid scientific QC decisions requires training under expert supervision.
These procedures can also be applied to low to medium resolution, inflection point XBT data. However, the lower resolution makes it more difficult to identify the structures described here.
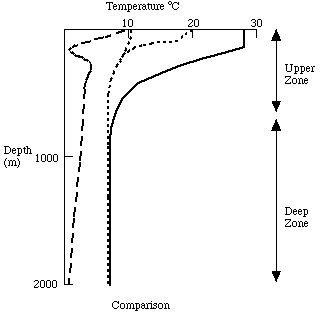
Temperature Structure in the Oceans
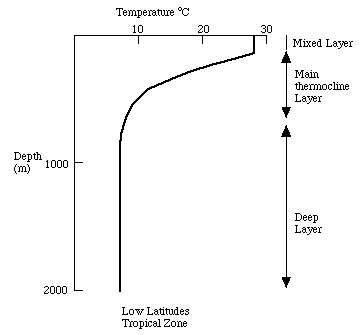
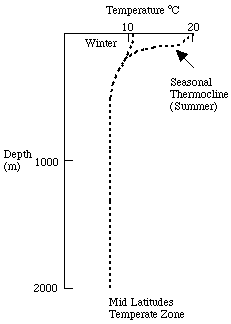
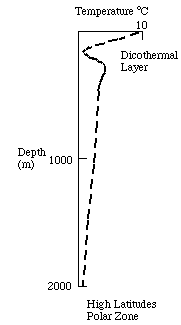
The vertical temperature structure in the ocean is generally divided into three zones. There is an upper mixed layer with fairly uniform temperatures similar to those at the sea surface. The thermocline is the zone below the mixed layer in which the temperature gradient (rate of change of temperature with depth) is at a maximum. Below the thermocline is a deep zone in which temperature changes slowly. The depths of these features vary with time and geographic location. Some typical XBT profiles are depicted in Figure 1.
Sea surface temperatures in the open ocean generally vary between a maximum of 30°C near the equator to a minimum of -1.9°C (freezing temperature of seawater) at high latitudes. The temperature at the sea surface is often representative of the temperature over a range of depths that are well mixed by wind and wave action. Heat is transferred downwards to the deeper layers by the action of turbulence. A high degree of vertical uniformity with little variation in temperature, salinity, or density is therefore often observed in the upper layer.
The surface mixed layer exhibits characteristic seasonal (especially in the mid and high latitudes) and regional variations in response to the local climatic conditions; and the depth of the mixed layer varies accordingly. During winter the mixed layer depth is enhanced by cooling from the surface and by strong wind and wave action. During summer, the winds are generally lighter and the mixed layer does not usually extend as far. Generally the mixed layer is between 50-100 m thick in low latitudes and 25-250 m (extending to the permanent thermocline) in mid latitudes. In high latitudes a near constant temperature profile can sometimes be observed over hundreds of metres depth.
Seasonal effects are limited to a narrow range of depths in the ocean by the extent of vertical mixing. A ìseasonalî thermocline may develop in some regions (mid and high-latitudes) from the surface to about 200 m depth in response to heating by the atmosphere. Summer warming accentuates the thermocline by diminishing the density of the surface layers, while winter cooling erodes the thermocline and establishes the mixed layer. The depth range from below the seasonal thermocline to about 1000 m is known as the ìpermanentî or oceanic thermocline. This is the transition zone from the warm waters of the surface layer to the cold waters in the deep ocean. The ìpermanentî thermocline is consistently present extending from 100ñ1000 m depth at low latitudes and from 200ñ1000 m at mid latitudes. However, no permanent thermocline is established at high latitudes (polar regions).
Although the temperature in the upper zone shows seasonal and regional variations in response to the local climatic conditions, the deep zone remains fairly constant in both these respects with a well defined temperature-salinity relationship. Most types of XBT are designed to measure the vertical temperature structure in the top 450 m to 750 m of the water column so they do not generally extend far into the deep zone.
Apart from the mixed layer and thermocline, many other subtle changes in the ocean's vertical temperature structure may also be observed in an XBT temperature profile by a trained observer. Different types of fine structure associated with intrusions, convection or turbulent mixing events, on vertical scales of tens of centimetres to hundreds of meters, can often be picked up in an XBT profile, or series of profiles. Temperature inversions are often observed as an increase of temperature with depth in a profile and occur in regions of the ocean in which the local conditions favour their formation (e.g. inversions in the mixed layer are sometimes observed in the tropics). Other meso-scale ocean features such as eddies, fronts or convergence zones, may be pin-pointed by large temperature differences over a large depth range from one profile to another.

Overview of Quality Control Procedures
The CSIRO XBT Quality Control process uses a visual approach combined with an interactive editor to check and flag the data. The header information is tested for correct time, position and other operator errors. The vertical profiles are inspected for common malfunctions, regional oceanographic features, drop to drop consistency along the cruise track, and repeat drops of unusual features. Features may be further checked with CTD data as opportunities arise. Figure 2 shows the steps involved in the CSIRO quality control process. All unedited/raw data is stored in a separate archive for future reference if required.
The Header information is assessed first, as the detection of these errors is more straightforward than for the profile data. Errors detected in the time and position fields are corrected if possible; however, if these cannot be resolved with a reasonably high degree of confidence the vertical profile data is considered unusable as it cannot be properly referenced. The original position of XBTs deployed during a voyage are viewed in the form of a cruise track plot. This is done for verification of the profile positions before individual profile plots are examined. A program is then run to verify the position, time and speed of the vessel along the cruise track. The test probe information is checked to ensure the integrity of the measuring equipment.
Once the header information has been validated, the individual profile plots are inspected for common malfunctions, regional oceanographic features and profile to profile consistency. Unusual features are cross validated by comparison with repeat or neighbouring profiles, and by using an archive of previously observed oceanographic features in particular regions. Doubtful features can appear and be flagged at any point in the profile. If anomalous features are present, the operator should question the validity of the profile(s) and when in doubt always look at a repeat or neighbouring drop for confirmation. A repeat drop is an XBT that has been done within 15 minutes (or 10 km) of another drop and a neighbouring drop is an XBT that is within 100 km of another drop. Care must be taken in labelling features as doubtful, since variations in thermal structure do exist, particularly in regions of oceanic fronts and eddies. Variations can also occur in less dynamic regions. Checking profiles with repeat or neighbouring drops and against an archive of regionally observed oceanographic features should be done on a regular basis. All profiles are also checked against Levitus climatology (Levitus, 1982) and/or a climatology that has been constructed from the CSIRO archive of XBT data.
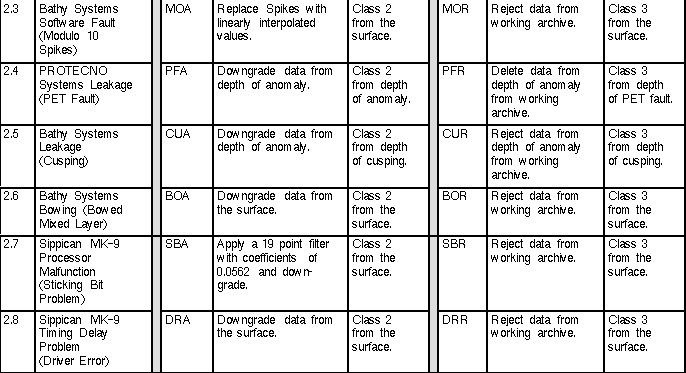
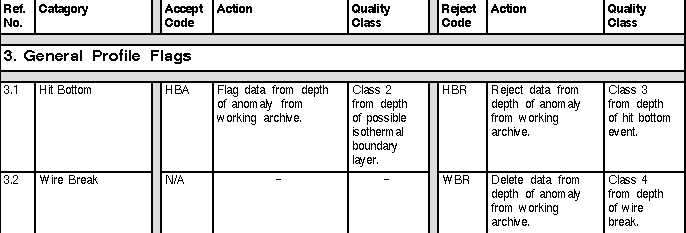
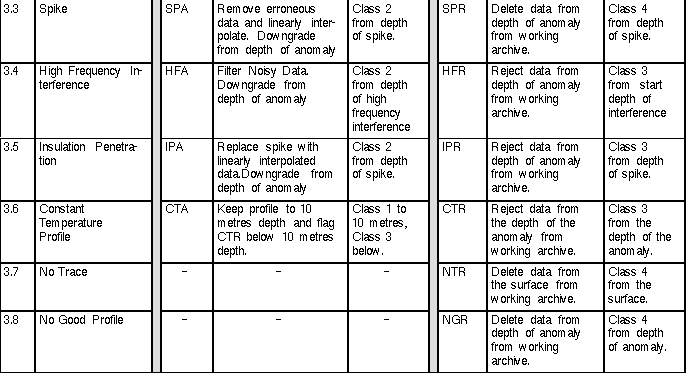
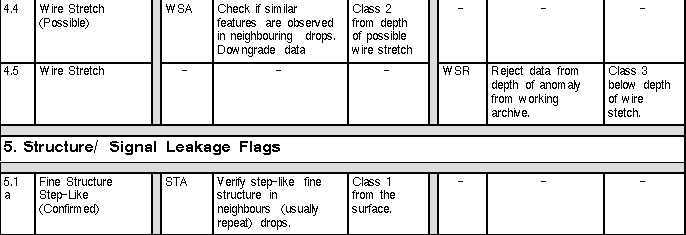
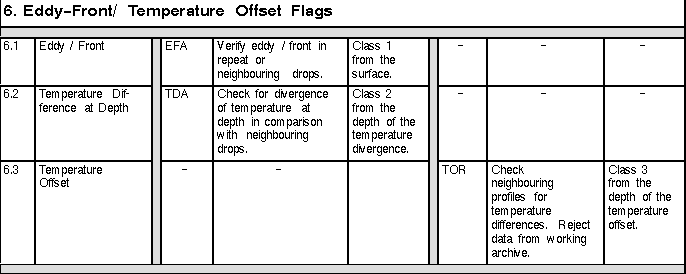
The profile data is then edited to remove start-up transients (see section 2.1) and other malfunctions, and to flag real oceanographic features. Depending on the severity of the problem, the data quality may be downgraded. The XBT profile data are classed (0-4) by depth according to the type of quality control flag(s) associated with the data. The grading system is outlined in Table 1, "Data Quality Classes". All modifications that are made to the data are reflected in coded quality flags. Anomalous features present within the profile data are flagged to indicate whether the feature is a real or probable oceanographic feature, or whether it is a possible or definite malfunction. Table 2, "Summary of CSIRO Quality Control Codes" outlines the codes (flags) which may be assigned to features and malfunctions observed in the XBT data during the CSIRO quality control process. Results of the profile QC process are recorded and stored in association with each temperature/depth pair.
Since there are real oceanographic features and XBT malfunctions which may appear very similar to each other, a decision must be made about which QC flag to use. There are two general types of flag that can be applied: an accept flag and a reject flag. The accept flag is used in instances where you can be sure that the feature is real, or if a malfunction is thought to result in minimal impact on the quality of the data. If there is doubt about the feature, or the impact to the quality of the data is severe, then the reject flag is used. Inflection point data (including BATHY messages) must be quality controlled with a certain amount of caution as these data are of lower resolution. Many of the subtle features that are identified in this cookbook will not be encoded in the message, and therefore may be difficult to detect.
Automated programs are used to aid in the process of detecting position and timing errors that are allocated flags from the header information category. However, detection and flagging of the profile data requires careful attention and experience as many of the instrument errors may look like real features to the untrained eye. For example, a temperature inversion and a wire stretch both exhibit an increase in temperature with depth when observed in an XBT profile. There can sometimes be a variety of errors and oceanographic features recorded within the profile structure. The profile feature/error flags are assigned according to the following categories; general flags, inversions/wire stretch, structure/leakage or eddy, front or current/temperature offsets.
The detailed explanation of these codes is
the subject of the remainder of this manual and should help facilitate
and standardise the process of scientific quality control. The
codes have been designed to be used as a research tool as well
as quality control indicators, such that when the occurrences
of flags are mapped, we can build an understanding of regional
variations in features of interest. This can then be used to better
determine whether an apparent feature is scientifically probable
for a certain area. If in doubt about applying an accept or reject
flag to the profile, the QC operator should take a conservative
approach and use the flag that results in the lower class of data.
The classes have been constructed to be sufficiently flexible
so that good data will rarely be discarded if this method is followed.
Table 1. Data Quality Classes
| Class | Quality | Description |
| Class 0 | No QC done | Class 0 data are the level at which all data enter the working archive. They have not yet been quality controlled. |
| Class 1 | Good data | Class 1 data are top quality data in which no malfunctions have been identified and all real features have been verified during the quality control process. |
| Class 2 | "Probably" good data | Class 2 data are good data in which some features (probably real) are present but these are unconfirmed. Class 2 data are also data in which minor malfunctions may be present but these errors are small and/or can be successfully corrected without seriously affecting the overall quality of the data. Data are downgraded to Class 2 from the depth of anomalous (probably real) features. |
| Class 3 | "Probably" bad data | Class 3 data are suspect data in which unusual, and probably erroneous features are observed, Data are downgraded to Class 3 and rejected (may be retrieved) from the working archive from the depth of the anomalous (probably erroneous) features. |
| Class 4 | Bad data | Class 4 data are data in which obviously erroneous values are observed. Data are downgraded to Class 4 from the depth of the erroneous features. |
| Class 5 | Changed | Class 5 data are values that have been changed as a result of quality control. The original values (before the change) are preserved. |
Table 2. Summary of CSIRO Quality Control Codes





The temperature profile data represents the
most challenging and interesting aspect of the quality control
of XBT data. When an XBT probe is launched, the data recording
cycle is triggered by contact of the sea electrode with the sea
surface. Data recording continues for a time period corresponding
to the probe's rated depth. As the probe descends through
the water column, insulated copper wire is unreeled simultaneously
from the probe spool and from the canister spool in the XBT launcher.
This wire provides a sensor line from the probe to the computer
on board the vessel. Temperature changes in the surrounding water,
measured as change in electrical resistance, are generally recorded
in the bridge circuit at a rate of 10 Hz (~65 cm depth intervals)
and a resolution of ± 0.01°C. The water depth is not
sensed directly by the probe but calculated from the time elapsed
since probe contact with the water and the probe's expected
fall rate. The XBT probe accuracy is rated to ± 0.15°C
so that noise of this order or smaller can usually be ignored.
Many types of malfunctions can cause erroneous
temperature readings in the temperature profile. The faults may
be restricted to a spike in a single recorded temperature value,
or may effect the temperature over a range of depths. The errors
may have a high wave-number/jittery appearance or may be smooth
features over 10's of metres. Some of these malfunctions
produce temperature errors that resemble real features such as
temperature inversions or fronts. Many of the profiles can be
"cleaned up" by deleting or filtering a portion of
the original data. For example, high frequency noise caused by
radio interference, which is observed as regularly spaced and
symmetric oscillations, can often be filtered to reveal a smooth
undisturbed profile, even if of large amplitude (>5°C).
The data will be flagged as having been filtered and downgraded
to "Class 2"; from the depth of filtering to indicate
that changes have been made to the original data. Sometimes the
data cannot be recovered after instrument malfunctions and the
data from the depth of the malfunction is downgraded to either
"Class 3" or"Class 4".
The QC flags in the Header Information
category are concerned with the correctness of the time, position
and probe type identifier fields contained in the Header of the
XBT record. All the data for one voyage are assembled, ordered
by time/date and a speed check program is executed to verify that
the ship is travelling at a valid speed (0 to 25 knots). Any observations
that fail this test are first identified, and then manually corrected
(if possible), and assigned the appropriate flag to indicate what
action was taken, i.e., a position was changed (flagged PEA) or
a time/date field was changed (flagged TEA). If these fields can
not be corrected with confidence then a reject flag (PER or TER
respectively) is assigned to indicate that the field is in error.
The "other/probe type" flag is assigned for errors
that have resulted from operator errors.
1.1 Position Error (PE)
Description A position error
is an error in a position field (latitude or longitude) which
has been identified from the speed check program.
1.1A Accept Code: PEA
Use: The PEA flag is used if the position error can be successfully corrected with confidence in the new value.
Action: Manually correct the old value and re-run the speed check to validate the new value. Downgrade data to class 2 from the surface.
Quality Class: Class 2 from the surface.
1.1R Reject Code: PER
Use: The PER flag is used if the error can not be corrected.
Action: Do not correct the error when in doubt about the new value. Downgrade data to Class 3 from the surface and reject from the working archive.
Quality Class: Class 3 from surface.
1.2 Time Error (TE)
Description A time error is
an error in the time/date field (hour, day, month, year) which
has been identified from the speed check program.
1.2A Accept Code: TEA
Use: The TEA flag is used if the time error can be successfully corrected with confidence in the new value.
Action: Manually correct the old value and re-run the speed check to validate the new value. Downgrade data to class 2 from the surface.
Quality Class: Class 2 from the surface.
1.2R Reject Code: TER
Use: The TER flag is used if the error can not be corrected.
Action: Do not correct the error when in doubt about the new value. Downgrade data to Class 3 from the surface and reject from the working archive.
Quality Class: Class 3 from surface.
1.3 Other/Probe Type Error (OP)
Description An
other/probe type error occurs when the probe type (or other value
in header field) is entered incorrectly by the observer (e.g.
T4 is entered instead of T7 for probe type).
1.3A Accept Code: OPA
Use: The OPA flag is used if the error can be successfully corrected with confidence in the new value or if the error had no effect on the quality of the data.
Action: Manually correct and replace the new value with the old value. Downgrade data to class 2 from the surface.
Quality Class: Class 2 from the surface.
1.3R Reject Code: OPR
Use: The OPR flag is used if the error can not be successfully rectified or there is an element of doubt about the new value to be substituted. The data is therefore considered to be uncorrectable.
Action: Downgrade data to Class 3 from the surface and reject from the working archive.
Quality Class: Class 3 from the surface.
1.4 Repeat Drop (RE)
Description A
repeat drop is defined as an XBT deployed within 15 minutes of
another one due to:
- Suspected previous probe malfunction,
- Desire to confirm a suspected real feature, or
- High density sampling
1.4A Accept Code: REA
Use: The REA flag is used if a repeat drop was done for one of the reasons outlined above.
Action: There is no change to the class of data.
Quality Class: Class 1 from the surface.
1.4R Reject Code: RER
Use: The RER flag is used if a repeat drop is considered dubious due to a malfunction.
Action: Downgrade data to Class 3 from the surface and reject from the working archive.
Quality Class: Class 3 from surface.
1.5 Duplicate Drop (DU)
Description A duplicate drop
is one of two or more copies of an XBT profile that is already
in the database. One copy will usually be accepted as superior
and retained, though flagged with the DUA code. All others will
be rejected with the code DUR.
1.5A Accept Code: DUA
Use: The DUA flag is used if a drop is a second copy of an XBT profile that is already in the database. It is usually superior (i.e., a full resolution version of a corresponding BATHY message).
Action: There is no change to the class of data.
Quality Class: Class 1 from the surface.
1.5R Reject Code: DUR
Use: The DUR flag is used if a drop is a second copy of an XBT profile that is already in the database. It is usually inferior (i.e., a BATHY message version of a corresponding full resolution drop).
Action: Downgrade data to Class 3 from the surface and reject from the working archive.
Quality Class: Class 3 from the surface.
The components of the XBT system include a
recorder/processor that processes the data received over the fine
wire link from the XBT via the launcher to the computer. This
processor unit conditions, digitises and transmits the data. Errors
in the measurement of temperature by the probe can be caused by
malfunctions in any of the components. The Recorder Flags have
been defined to distinguish between these errors. The faults are
often particular to a given brand of XBT system (Sippican, Bathy
Systems or PROTECNO), or a particular hardware/software component
of the system.
2.1
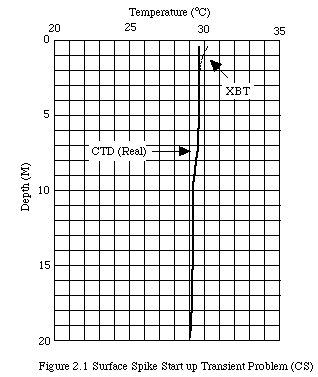
Surface Spikes (CS)
Description Surface
spikes are caused by a minor start-up transient problem that leads
to inaccurate temperature measurements in the top few metres of
a temperature profile (For more information, refer to Roemmich
and Cornuelle, 1987, and Bailey et al., 1989).
2.1A Accept Code: CSA
Use: The CSA flag is applied to all XBT profiles in which the surface spike is undetectable below 3.7 m depth, as the start-up transient problem is ubiquitous. In the rare case where the surface transient is detected below 3.7 m depth, but the overall quality of the data is considered to be unaffected, the affected values are replaced by 99.99.
Action: Surface data is removed to 3.7 m depth and replaced with 99.99 to indicate no data. No change to the class of data.
Quality
Class Class 1 from the surface.
2.1R Reject Code: CSR
Use: The CSR flag is used if the surface transient is detectable below 3.7 m depth and the quality of the data is considered to be affected.
Action: Downgrade data to Class 3 from the surface and reject from the working archive.
Quality Class: Class 3 from the surface.
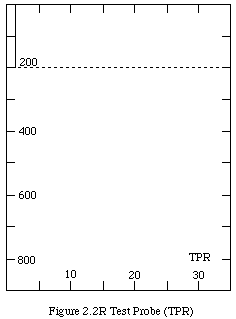
2.2 Test Probe (TP)
Description Test
probes and devices are regularly used for testing or calibrating
XBT systems. A test probe is recognised by a characteristic isothermal
temperature profile, usually 1.5°C ±0.15°C.
2.2A Accept Code: N/A
2.2R Reject Code TPR
Use: The TPR flag is used in all cases where a test probe has been used.
Action: Downgrade test data to Class 4 from the surface and delete from the working archive on all occasions.
Quality Class: Class 4 from the surface.
2.3
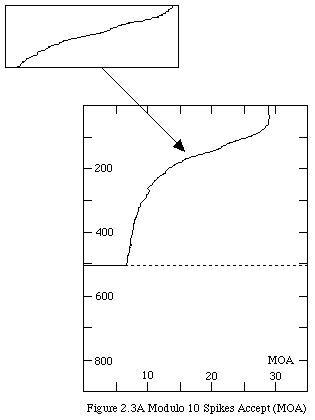
Bathy Systems Software Error or Modulo 10 Spikes (MO)
Description The
Bathy Systems Software Error is termed Modulo 10 Spikes because
it is a data acquisition software problem associated with early
versions of the Bathy Systems SA-810 XBT system in which a spike
is introduced at 10 point intervals (i.e., every tenth digitisation)
in the profile data.
2.3A Accept Code: MOA
Use: The MOA flag is used if regular spiking is seen in a profile that has been recorded with a SA-810 XBT system.
Action: Spikes are replaced with linearly interpolated values. Downgrade data to class 2 from the surface.
Quality
Class: Class 2 from the surface.
2.3R Reject Code: MOR
Use: The MOR flag is used when large spikes (>0.2°C) which are difficult to interpolate are seen in a profile that has been recorded with a SA-810 XBT system.
Action: Downgrade data to Class 3 from the surface and reject from the working archive.
Quality Class: Class 3 from the surface.
2.4
PROTECNO Systems Leakage or PET Fault (PF)
Description The
PROTECNO Systems Leakage or PET fault is a problem specific
to the PROTECNO recorder/processor that causes a leakage-type
of malfunction. This can often be masked by the temperature gradient.
Generally the leakage is more evident toward the bottom of a
profile, where the temperature gradient is small. It is a common
fault in data recorded by earlier versions of this System.
2.4A Accept Code: PFA
Use: The PFA flag is used when the beginning of the PET problem is not obvious (i.e., temperature at depth is consistent relative to neighbouring profiles) because it has been masked by the temperature gradient. The suspected start of a PET problem is flagged PFA as a cautionary measure.
Action: Check profile with a repeat or neighbouring profile. Downgrade the data to Class 2 from depth of anomaly.
Quality
Class: Class 2 from depth of suspected PET fault.
2.4R Reject Code: PFR
Use: The PFR flag is used if clear leakage occurs in a profile that has been recorded with a PROTECNO System, (i.e., the temperature at depth is inconsistent or warmer compared to neighbouring profiles).
Action: Downgrade data to Class 3 from depth of anomaly and reject from the working archive.
Quality Class: Class 3 from starting depth of PET fault.

2.5
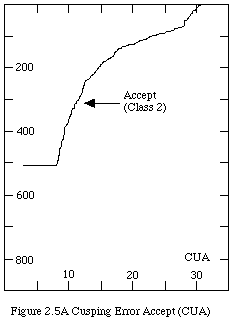
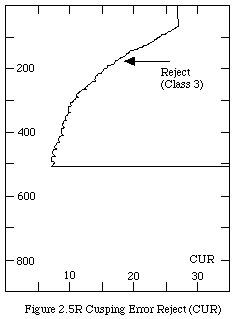
Bathy Systems Leakage or Cusping (CU)
Description Bathy
Systems Leakage or cusping is a malfunction particular to early
versions of the Bathy System SA-810 unit. Leakage associated with
this recorder/processor causes a characteristic cusping signal
to be embedded in the profile.
2.5A Accept Code: CUA
Use: The CUA flag is used if small amplitude (<0.2°C) periodic cusping is embedded in a profile recorded with an early Bathy Systems SA-810 unit and the error is considered small enough not to seriously effect the overall quality of the data.
Action: Downgrade data to Class 2 from depth of anomaly.
Quality
Class: Class 2 from the start of cusping.
2.5R Reject Code: CUR
Use: The CUR flag is used if large amplitude (>0.2°C) periodic cusping is embedded in a profile recorded with a Bathy Systems SA-810 unit.
Action: Downgrade data to Class 3 from depth of anomaly and reject from the working archive.
Quality Class: Class 3 from start of cusping.
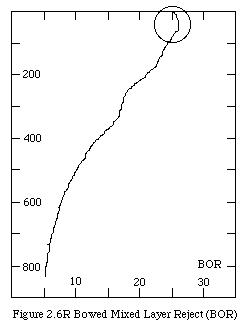
2.6 Bathy Systems Bowing Problem
or Bowed Mixed Layer (BO)
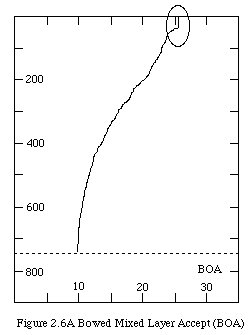
Description The
Bathy Systems Bowing Problem or bowed mixed layer is an apparently
inconsistent temperature measurement observed with an early version
of the Bathy systems SA-810 XBT recorder (see Bailey et al., 1989).
This problem manifests itself as an erroneous, gradual increase
(bowing) in the temperature profile with depth that is most notable
in the mixed layer zone (i.e., a normally isothermal layer of
constant temperature). The apparent cause is insufficient current
being driven down the XBT wire by the SA-810 recorder. The wire
is only quality assured to carry around 150-200 microamps,
and the early version of the SA-810 drives approximately 20 microamps
down the wire. Any slight imperfections in the wire (such as
damage to the insulation) cause problems at these lower current
levels.
2.6A Accept Code: BOA
Use: The BOA flag is used if the magnitude of the resulting error is small (i.e., warming of ~0.2°C in the mixed layer) or difficult to detect. BOA can be used as a cautionary flag to mark a potentially realistic inversion detected in the mixed layer of a profile recorded with a Bathy Systems SA-810 unit.
Action: Downgrade data to Class 2 from the surface.
Quality
Class: Class 2 from the surface.
2.6R Reject Code: BOR
Use: The BOR flag is used if an unrealistic inversion (warming of >0.2°C in a region where inversions have not previously been observed) is detected in the mixed layer of a profile recorded with a Bathy Systems SA-810 unit).
Action: Downgrade data to Class 3 from the surface and reject from the working archive.
Quality Class: Class 3 from surface.

2.7 Sippican MK-9 Processor Malfunction or Sticking Bit Problem (SB)
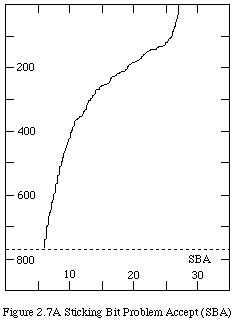
Description The
Sippican MK-9 Processor Malfunction or Sticking bit problem is
a Sippican MK-9 firmware problem associated with the storage of
bit information that results in continuous, small amplitude, step-like
features in the profile. The steps can usually be filtered using
a running mean or a median filter (on most occasions a median
filter is used over 19 points), without degradation to the overall
profile data.
2.7A Accept Code: SBA
Use: The SBA flag is used if small amplitude step-like features are observed in a profile recorded with a version of the MK-9 unit known to exhibit this problem.
Action: Apply a 19 point median filter with coefficients of 0.0526. Downgrade data to Class 2 from the surface.
Quality
Class: Class 2 from surface.
2.7R Reject Code: SBR
Use: The SBR flag is used if large amplitude step-like features are observed in a profile recorded with a version of the MK-9 unit known to exhibit this problem.
Action: Downgrade data to Class 3 from the surface and reject from the working archives.
Quality Class: Class 3 from surface.
2.8
Sippican MK-9 Timing Delay Problem or Driver Error (DR)
Description
The Sippican MK-9 timing delay problem or driver error is an error
in the recognition of the start of descent of an XBT (i.e., probe
contact with water) that results in a depth error. This error
has been detected during testing of some versions of the Sippican
MK-9/MS-DOS XBT system. The problem is due to a software error
in the recognition and handling of different versions of the GPIB
(interface from MK-9 to XBT) driver routines. The resultant data
errors are highly erratic and random in nature, and in most cases
the degree of depth error is indeterminable in data collected
in the field under normal conditions. Later versions of the software
do not suffer from this problem. (For more information refer
to Intergovernmental Oceanographic Commission, 1992: Summary report
on the Ad Hoc Meeting of the IGOSS Task Team on Quality Control
for Automated Systems, Marion, Massachusetts, USA, 36 June 1991.
IOC/INF-888, pp 144).
2.8A Accept Code: DRA
Use: The DRA flag is used on all XBT profiles that were recorded with the offending software/hardware combination. The data was corrected by adding the number of metres corresponding to the MODE of the timing delay (2.6 s) as calculated by bench top tests of the relevant equipment. A further 4 metres of data has been deleted due to start up transients taking the total depth of affected data to 20 m.
Action: Downgrade data to Class 2 from the surface.
Quality
Class: Class 2 from surface.
2.8R Reject Code: DRR
Use: The DRR flag is used if the data do exhibit extreme inconsistencies and were recorded with the offending software/hardware combinations. No correction is applied.
Action: Downgrade data to Class 3 from surface and reject from the working archives.
Quality Class: Class 3 from surface.
The "general profile" subcategory
of flags includes malfunctions that are routinely observed and
which require interpolation, deletion or filtering of the data.
These include wire breaks and various types of spikes introduced
by outside electrical interference. Many of the spike type errors
can be interpolated or filtered with the remaining temperature
records being unaffected. If the interference is severe this will
not be the case, and the quality of the remainder of the temperature
records in the profile will be downgraded. Also included in this
category are cases where the probe hits the bottom and data below
this depth must be rejected.
3.1
Hit Bottom (HB)
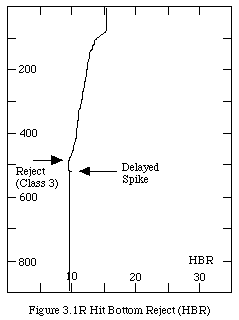
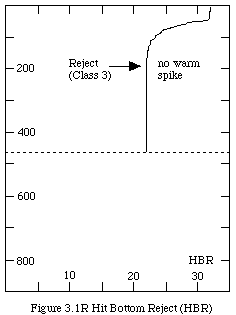
Description When
the probe hits the bottom, the temperature trace usually goes
isothermal (as the fall rate equation still assumes the probe
to be descending). Contact with the bottom is often indicated
by a small horizontal spike or undulation. The spike can be due
to overheating of the thermistors or physical contact with the
bottom. Data recorded beyond the hit bottom event is rejected
as erroneous.
3.1A Accept Code: HBA
Use: The HBA flag is used if the isothermal layer recorded before a hit bottom event is suspected to be a real bottom isothermal boundary layer. This layer is often difficult to detect as the hit bottom spike may not always be clearly marked and the data recorded after the hit bottom event are also of constant temperature.
Action: Downgrade the data to Class 2 from depth of anomaly.
Quality Class: Class 2 from depth of possible isothermal boundary layer.
3.1R Reject Code: HBR
Use: The HBR flag is used if a hit bottom event is indicated by the trace.
Action: Downgrade data to Class 3 from depth of hit bottom indicator and delete from working archive.
Quality Class: Class 3 from depth of hit bottom event.

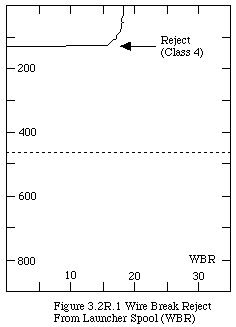
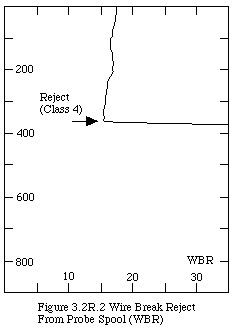
3.2 Wire Break (WB)
Description When
the XBT wire breaks, a short circuit causes the temperature readings
to go off scale either to the low (wire breaks from the spool
in the launcher) or to the high (wire breaks from the descending
probe's spool) temperature end of the scale. The main causes
of wire breaks can be fouling or if the terminal depth of the
probe is reached (i.e., a good XBT cast in deep water ends with
a wire break). Often a wire stretch will precede a wire break
(see also WS wire stretch).
3.2A Accept Code: N/A
3.2R Reject Code: WBR
Use: The WBR flag is used if the bottom of the XBT profile exhibits a sudden deflection to the high or low temperature end of the scale.
Action: Downgrade data to Class 4 from depth of initial point of damage and delete from working archive.
Quality Class: Class 4 from depth of wire break.
3.3
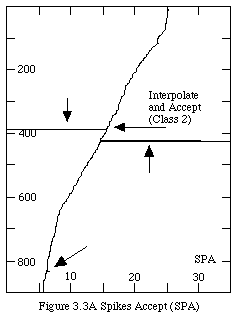
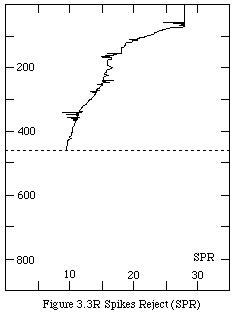
Spikes (SP)
Description Isolated
or intermittent spikes can be the result of external electrical
or electromagnetic interference that influences the XBT system's
output. Ship's radio signals, lightning and XBT wire shorting
against the side of the ship can often cause spikes in the profile.
Spikes may appear to be severe but temperatures may often be successfully
interpolated. A spike in the profile data is generally considered
to be >0.2°C as the accuracy of the XBT instrument is
rated to ±0.15°C so that noise of this order or smaller
can usually be ignored.
3.3A Accept Code: SPA
Use: The SPA flag is used if the spike is restricted to a narrow range of depths (i.e., only one or two temperature records) and the remaining temperature records are considered to be unaffected after interpolation.
Action: Remove and linearly interpolate data between erroneous points. Downgrade data to class 2 from depth of anomaly.
Quality Class: Class 2 from depth of spike.
3.3R Reject Code: SPR
Use: The SPR flag is used if severe spiking (>0.2°C and over a wide range of depths) occurs which can not be interpolated and the remaining temperature records are considered unreliable.
Action: Downgrade data to Class 4 from depth of anomaly and delete from working archive.
Quality Class: Class 4 from depth of spike.
3.4
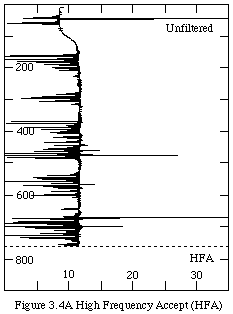
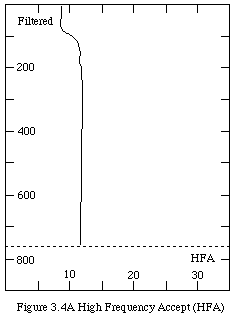
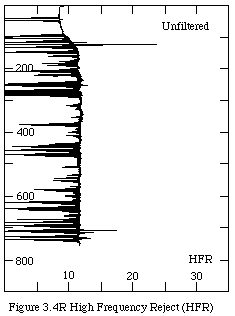
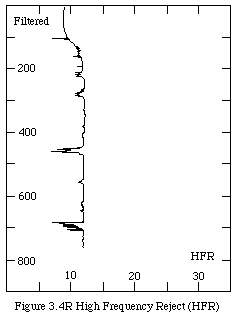
High Frequency Interference (HF)
Description As
for spikes, high frequency interference is caused by electrical,
or electromagnetic, interference, but results in continual spiking
over a wide range of depths. Interference may sometimes appear
severe but the temperature records underneath can often be successfully
interpolated by filtering.
3.4A Accept Code: HFA
Use: The HFA flag is used if the interference superimposed on a valid profile can be filtered without affecting the underlying profile. The validity of the underlying profile is established through comparison with neighbouring profiles.
Action: Apply a standard median filter or weighted mean filter to the selected number of data points. Re-check the profile to verify that spikes have been removed and compare to neighbouring profiles to ensure it has not been corrupted. Downgrade data to Class 2 from depth where filter was first applied.
Quality
Class: Class 2 from depth of filtering.
3.4R Reject Code: HFR
Use: The HFR flag is used if there is severe interference or if filtering fails and the temperature records are considered to be corrupt.
Action: Downgrade data to Class 3 from start of anomaly and reject from working archive.
Quality Class: Class 3 from start depth of interference.
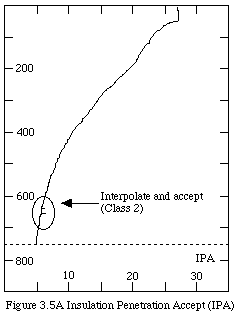
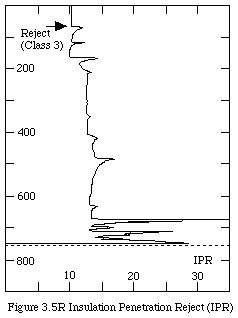
3.5 Insulation Penetration (IP)
Description An
insulation penetration appears as a sharp spike(s) towards the
high temperature end of the scale, generally followed by a gradual
recovery. This is caused by damage to the wire insulation. The
insulation damage will tend to heal itself by the interaction
between the wire and seawater; however caution must be observed
as the recovery may not be complete. Severe insulation penetration
causes continual elevated temperatures from the depth of the leakage.
(Note: insulation penetration is a special form of leakage, see
also LE leakage.)
3.5A Accept Code: IPA
Use: The IPA flag is used if the temperature is considered to have quickly and fully recovered from signs of insulation damage. There is a consistency of temperature readings at depth when compared with neighbouring profiles.
Action: Replace the spike with linearly interpolated data. Downgrade data to Class 2 from point of anomaly.
Quality
Class: Class 2 from depth of spike.
3.5R Reject Code: IPR
Use: The IPR flag is used if the profile is deemed not to have fully recovered from the insulation penetration spike. There is an inconsistency of temperature readings at depth when compared with neighbouring profiles.
Action: Downgrade data to Class 3 from depth of anomaly and reject from working archive.
Quality Class: Class 3 data from depth of spike.
3.6 Constant Temperature Profile
(CT)
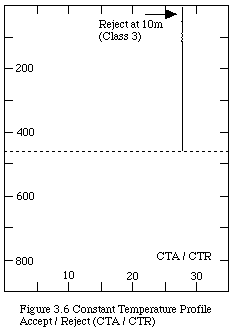
Description A
constant temperature profile is a record of temperature data that
appears abnormally isothermal. This event is the outcome of a
faulty probe (broken thermistor or the weighted nose has broken
off the probe) resulting in the system's inability to detect
a change in resistance and hence temperature.
3.6A Accept Code: CTA
Use: The CTA flag is used if the sea surface temperature of an isothermal profile is considered consistent (valid) on cross checking with neighbouring profiles.
Action: Keep profile data to 10 metres depth then flag CTR to downgrade data to Class 3 below 10 metres and reject from working archive.
Quality
Class: Class 1 to 10 metres; Class 3 below.
3.6R Reject Code: CTR
Use: The CTR flag is used to reject data from the surface if the profile is isothermal and if the surface temperature is inconsistent (invalid) with that of neighbouring profiles. It is also used to reject data below 10 m depth in profiles flagged CTA, and to reject data from the depth where temperatures become anomalously constant when no other fault is evident.
Action: Downgrade data to Class 3 from the affected depth and reject from working archive.
Quality Class: Class 3 from the depth of the fault.
3.7
No Trace (NT)
Description No
trace indicates that there is no profile data recorded or that
the data is completely off-scale. This can be due to a number
of reasons such as a wire break before the probe makes contact
with the water or an observer launching a probe before the system's
set-up procedures are complete.
3.7A Accept Code: N/A
3.7R Reject Code: NTR
Use: The NTR flag is used if no data has been recorded or if recorded data is totally off scale.
Action: Downgrade data to Class 4 from the surface and delete from working archive.
Quality
Class: Class 4 from the surface.
3.8 No Good (NG)
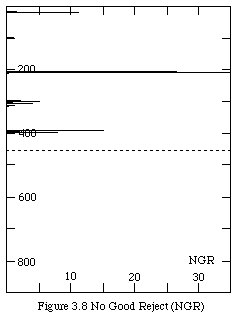
Description A
"no good" profile is a profile in which the data
are completely and obviously erroneous. This can happen for any
of the reasons described. This flag is also used to "clean
up" (delete) data that would otherwise be retained as Class
3 but is obviously Class 4.
3.8A Accept Code: N/A
3.8R Reject Code: NGR
Use: The NGR flag is used if all or a portion of the profile is obviously erroneous.
Action: Downgrade data to Class 4 from depth of the error and delete from working archive.
Quality Class: Class 4 from depth of the error.
4. Inversion / Wire Stretch Flags
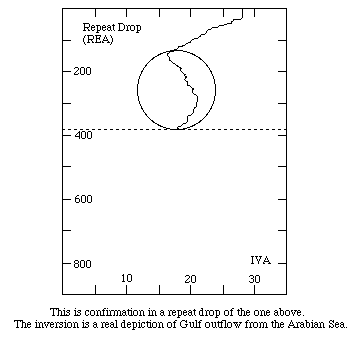
Temperature inversions are common, real features of the ocean. An inversion is a stable increase of temperature with depth as a result of compensating salinity structure and is identified by a characteristic bulge to the high temperature side of an XBT profile. There is, however, a class of malfunctions (wire stretch) which can look very similar. Distinguishing between the two can be difficult. Whereas an inversion is a real increase of temperature with depth, a wire stretch because of an increase in tension in the wire (due to poor unreeling) can result in a similar bulge to the high temperature side of an XBT profile. The approach taken in the quality control of profiles showing an increase in temperature with depth, therefore, is to be conservative. Only those features that have either been confirmed by a check between neighbouring profiles (usually repeat drops), or have been observed in an area where inversions are known to occur are flagged as real. Unconfirmed features are flagged according to the degree of confidence we have in them. If the anomaly is suspected to be erroneous it should be flagged as a wire stretch.
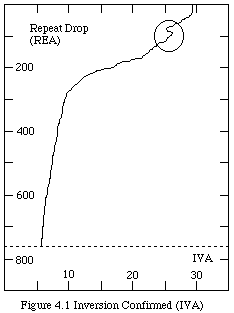
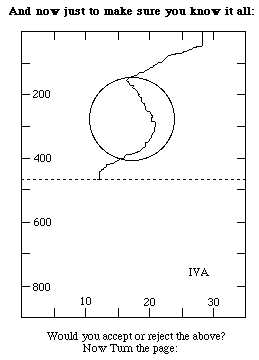
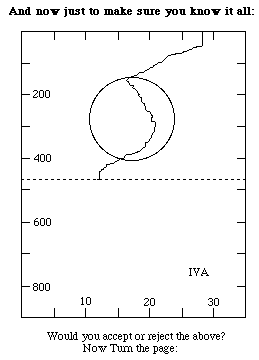
4.1 Inversion Confirmed Flag (IVA)
Description An
inversion is defined as a confirmed increase in temperature with
depth observed at some point in the profile. Confirmation is established
through the observation of the same feature in a neighbouring
(usually a repeat) drop. These features usually occur in specific
regions.
4.1A Accept Code: IVA
Use: The IVA flag is used if the inversion is confirmed to be a real feature by observing the same feature in a repeat or neighbouring drop.
Action: Verify if inversions have previously been observed in the region or are found in neighbouring drops. No change to class of data.
Quality
Class: Class 1 from the surface.
4.1R Reject Code N/A

4.2 Inversion in Mixed Layer Confirmed
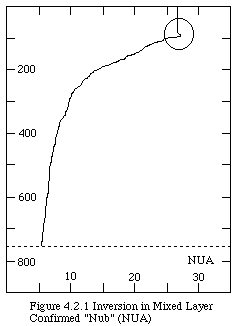
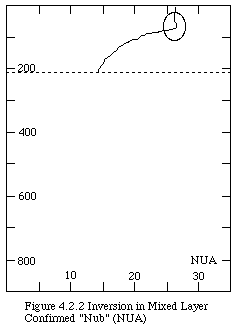
"Nub" Flag (NUA)
Description A
nub is a special type of inversion in which an increase of temperature
with depth is observed within or at the base of the mixed layer.
Confirmation is established through the observation of the same
feature in a neighbouring (usually a repeat) drop.
4.2A Accept Code: NUA
Use: The NUA flag is used if the nub is confirmed to be real by observation of the same feature in the mixed layer of a repeat or neighbouring drop.
Action: Verify if nubs have previously been observed in the region or are found in neighbouring drops. No change to class of data.
Quality
Class: Class 1 from the surface.
4.2R Reject Code N/A
4.3 Inversion Probable Flag
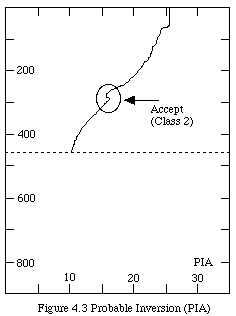
(PI)
Description A
probable inversion is defined as an increase in temperature with
depth observed at some point in the profile, but which is not
fully confirmed by a repeat or neighbouring drop. The feature
is considered to be probably real as inversions are known to occur
in the region or similar features are found in neighbouring drops.
4.3A Accept Code PIA
Use: The PIA flag is used if an inversion can not be completely confirmed by a neighbouring profile but the feature is probably real, because similar features have previously been observed in the region and in neighbouring profiles.
Action: Check if similar anomalies occur in neighbouring drops or if inversions have previously been observed in the region. Downgrade data to Class 2 from depth of anomaly.
Quality
Class: Class 2 from depth of probable inversion.
4.3R Reject Code N/A
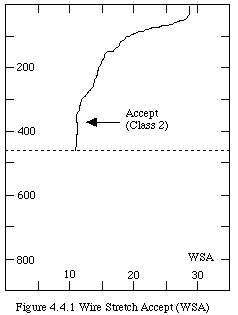
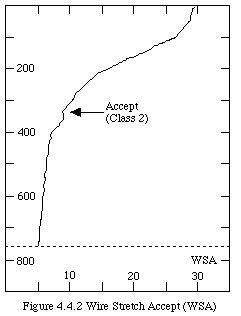
4.4 Possible Wire Stretch Accept
Flag (WSA)
Description A
possible wire stretch is an apparent warming of temperature with
depth at some point in the profile (usually small, ~0.2°C)
which is considered to be unusual as there is little knowledge
of inversions in the region and there is no confirmation from
a neighbouring profile. The anomaly is accepted, however, because
the magnitude of the inversion is small and/or there is also not
enough evidence to completely doubt the profile.
4.4A Accept Code WSA
Use: The WSA flag is used if the magnitude of the anomaly (warming) is small enough (~0.2°C over a small range of depths) that it does not seriously effect the overall quality of the data.
Action: Check if similar anomalies are observed in neighbouring drops or have previously been observed in the region. Downgrade data to Class 2 from depth of anomaly.
Quality
Class: Class 2 from depth of possible wire stretch.
4.4R Reject Code (See WSR, pg 62)
4.5 Wire Stretch Reject Flag
(WSR)
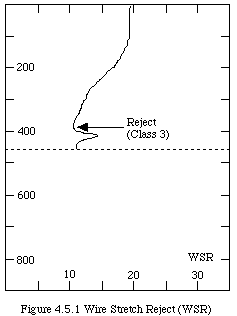
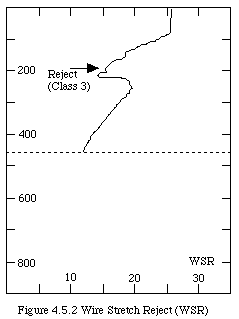
Description A
true wire stretch causes an abnormal increase of temperature with
depth (usually > 0.2°C observed over a large range of
depths). The feature is considered to be erroneous because temperatures
at depth are inconsistent (warmer) when checked against neighbouring
profiles. A wire stretch is often observed at the base of a trace
before a wire break, (see also WB Wire Break), or if fouling
or restricted unreeling occurs.
4.5A Accept Code (see
WSA, pg 60)
4.5R Reject Code WSR
Use: The WSR flag is used if an unrealistic bulge to the high temperature end of the scale is present that does not fully recover.
Action: Downgrade data to Class 3 from depth of anomaly and reject from working archive.
Quality Class: Class 3 below depth of wire stretch.
5. Structure / Signal Leakage Flags
Temperature profiles in the upper layers of the ocean can exhibit many types of real, fine scale structure that are generated by a variety of small scale mixing and turbulent processes. Fine structure specifically refers to structure in the hydrographic and flow fields of the ocean, on vertical scales of 1-100 metres. These are usually associated with horizontal scales of 1 m to 10 km and time scales of one minute to several days (McPhaden, 1985). One type of malfunction (leakage) can also result in temperature profiles with characteristics similar to fine scale structure. As was the case for inversions, it is often difficult to distinguish between the real feature and the malfunction so verification with neighbouring (or repeat) profiles and previous knowledge of the region is used for confirmation. Fine scale structure resulting from small scale mixing processes is commonly observed in a profile as many small step-like features or interleavings. Leakage may show similar characteristics; however the small-scale structure is often sharper and the temperatures below the depth of the anomaly will tend to be warmer when compared with neighbouring profiles. Like the inversion/wire stretch category there is again no clear black and white line between accepting or rejecting the profiles, and the different codes are allocated according to the degree of confidence that can be placed in the confirmation process. If the anomaly is suspected to be the result of a malfunction it should be flagged as leakage and rejected.
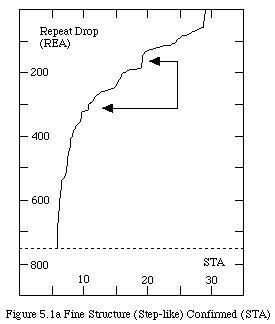
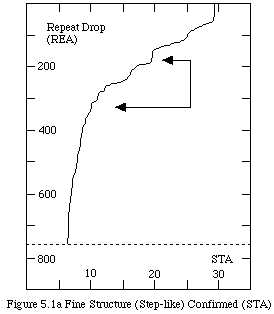
5.1a Fine Structure (Step-Like)
Confirmed Flag (STA)
Description Fine
Structure consists of step-like features or small interleaving
observed in a profile over a range of depths, (usually 10-100 m) or the entire profile. Thermostads, well-mixed regions
where temperature and density vary little with depth, also appear
as step-like features and so are included in this category. Confirmation
is established by observation of the same structure in a repeat
or neighbouring drop. This feature can occur in many regions.
5.1aA Accept Code STA
Use: The STA flag is used if highly structured step-like features are confirmed in a neighbouring (usually repeat) drop.
Action: Verify if small scale features have previously been observed in the region or found in neighbouring (usually repeat) drops. No change to class of data.
Quality
Class: Class 1 from the surface.
5.1aR Reject Code N/A
5.1b Fine Structure (Step-Like)
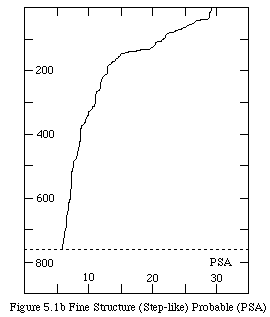
Probable Flag (PS)
Description Probable
fine Structure (step-like) appears as unconfirmed isothermal
or step-like features (including thermostads) observed in a profile
over a range of depths (usually 10-100 m) or the entire
profile. The vertical gradient of the feature or features is substantially
different from the background gradient and therefore resembles
a cascade or staircase (see FSA for a description of another
type of unconfirmed fine structure).
5.1bA Accept Code PSA
Use: The PSA flag is used if structured step-like features are observed in a drop but cannot be completely confirmed by a neighbouring profile. However, the feature is probably real because similar features have previously been observed in the region.
Action: Check if fine structure occurs in a neighbouring profile or has previously been observed in the region. Downgrade data to Class 2 from the surface.
Quality
Class: Class 2 from the surface.
5.1bR Reject Code N/A
5.2 Surface Anomaly, Fine Structure
Special Case Flag (SA)
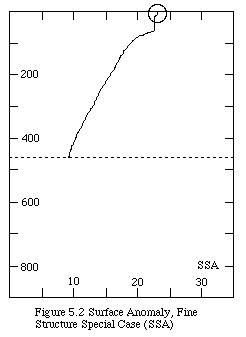
Description The
surface anomaly is a special case of fine structure that is limited
to the top 20 metres of the water column. A warm surface layer
can sometimes form from solar heating and light winds (often referred
to as the afternoon effect). The afternoon effect can warm surface
layers of between 2-10 m thick by up to 1°C. Cooler
freshwater layers due to precipitation or river-outflow can also
cause a surface anomaly to develop. A surface anomaly is generally
larger than 0.2°C. These surface features are often transient
and can have small spatial scales so you must be cautious and
remember that the XBT can have problems near the surface (see
Surface Spikes CS, Bowing BO, and Insulation Penetration
IP).
5.2A Accept Code SAA
Use: The SAA flag is used if a warm or cool anomaly (of >0.2°C) is detected in the top 20 metres of the water column.
Action: Check if surface anomalies have previously been observed in the region or found in neighbouring drops. Downgrade data to Class 2 from the surface.
Quality
Class: Class 2 from the surface.
5.2R Reject Code N/A
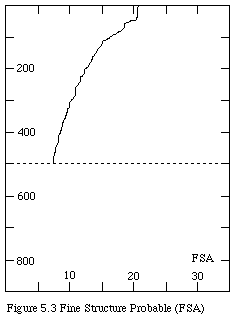
5.3 Fine Structure Probable Flag
(FS)
Description Probable
fine structure appears as unconfirmed, small-scale structure superimposed
on the temperature profile over a range of depths (usually 10-100 m) or in the entire
profile. It often appears as small scale interleavings in the
temperature profile. The structure is probably real because, although
confirmation can not be established, fine structure has been known
to occur in the region or similar features are observed in neighbouring
drops.
5.3A Accept Code FSA
Use: The FSA flag is used if the fine-scale structure can not be completely confirmed by a neighbouring profile but validity is considered highly probable as similar features have previously been observed in the region.
Action: Check if fine structure occurs in a neighbouring profile or has previously been observed in the region. Downgrade data to Class 2 from the surface.
Quality
Class: Class 2 from the surface.
5.3R Reject Code N/A
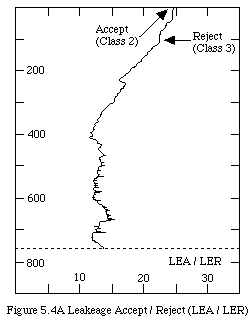
5.4 Leakage Accept Flag (LE)
Description Leakage
appears as apparent structure of "jitter" over a
range of depths (or the entire profile) that is considered to
be unusual as there is little evidence of similar structure in
the region, and/or there is no confirmation from a neighbouring
profile. This flag can be used if there is some element of doubt
whether the XBT system is working correctly, i.e., if there is
a suspected signal leakage problem with the recording equipment.
Where structure is observed in a BATHY message LEA will often be
used instead of FSA due to the low resolution of the data. Leakage
can also be a result of insulation penetration (see IPR)
which has not healed leading to continuous leakage, or damage
to the launcher cable or recorder.
5.4A Accept Code LEA
Use: The LEA flag is used if the shape of the feature is somewhat characteristic of signal leakage ("jittery"), but the magnitude of the anomaly is small enough (~0.2°C over a range of depths) to be considered not to seriously effect the overall quality of the data and/or there is not enough evidence to completely doubt the profile.
Action: Check if similar anomalies are observed in neighbouring drops or have previously been observed in the region. Downgrade data to Class 2 from the surface.
Quality
Class: Class 2 from the surface.
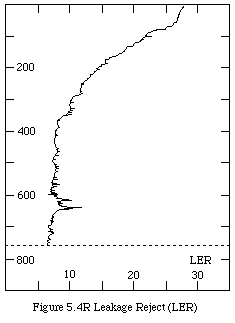
5.4R Reject Code LER
Use: If leakage is observed as erratic, sharp and unrealistic structure over a range of depths or the entire profile, the data must be rejected. Temperatures at depth are generally warmer than neighbouring profiles.
Action: Check profile with neighbouring drops and downgrade data to Class 3 from the depth of anomaly and reject from the working archive.
Quality Class: Class 3 from depth of leakage.
6. Eddy, Front or Current/ Temperature
Offset Flags
Eddies, oceanic fronts and currents are common
meso-scale features in the oceans. These often appear in profile
data as distinct increases and/or decreases in the temperature
over large depth ranges when compared to neighbouring profiles.
Depending on the horizontal sampling interval, a series of temperature
displacements with depth can sometimes be seen in alternating
or sequential drops as the ship crosses an eddy, current system
or frontal region. Again there are malfunctions which can resemble
these real features. An indication that the XBT may have malfunctioned
due to wire stretch (see WSA), leakage (see LER) or a probe defect
(see TOR) is often an observed temperature difference (>0.2°C)
at the bottom of the temperature profile when compared with its
neighbours. Care must be taken to distinguish between such temperature
offsets due to instrument malfunctions and ones due to real meso-scale
features in the ocean. This is particularly true if the XBT does
not sample to the bottom of the thermocline or if sampling is
not at intervals that will resolve the horizontal space scales
of the eddies, currents or fronts. Like the inversion/wire stretch
and fine-structure/leakage categories there is again no clear
black and white line between accept and reject flags and the different
codes are allocated according to the degree of confidence that
can be placed in the confirmation process. If the anomaly is considered
to be the result of a malfunction, it should be flagged as such
and rejected.
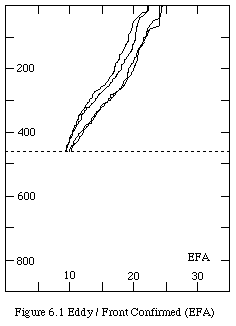
6.1 Eddy / Front / Current Confirmed
Flag (EFA)
Description An
eddy, front or current appears as an increase/decrease in temperature
over large depth ranges when compared to a neighbouring profile.
A temperature displacement can sometimes be seen in alternating
or sequential drops as the ship track crosses a current, eddy
system or frontal region. Confirmation of the feature is established
if neighbouring (usually repeat) profile pairs each side of the
front show similar temperatures at depth. Temperature sections
along the ship track can be used as further evidence these features
are real.
6.1A Accept Code EFA
Use: The EFA flag is used if neighbouring (usually repeat) profile pairs each side of the front show similar temperatures at depth.
Action: Verify eddy/front/current by repeat or neighbouring drops and establish if eddies/fronts/currents have previously been observed in the region. Plot the temperature section along the cruise track for further confirmation. No change to class of data.
Quality
Class: Class 1 from the surface.
6.1R Reject Code N/A
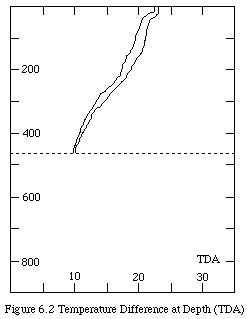
6.2 Temperature Difference at
Depth Flag (TDA)
Description A
difference in temperature at depth is observed when compared to
neighbouring profiles. The temperature difference can occur over
the entire profile but the defining feature is the offset at the
bottom of the profile. The feature is probably real as eddies,
fronts or currents are known to occur in the region, although
there is no exact confirmation from neighbouring profiles.
6.2A Accept Code TDA
Use: The TDA flag is used if a temperature difference (>0.2°C) at depth is observed when compared to neighbouring profiles but this difference cannot be confirmed as real. Eddies or fronts are known to occur in the region, however, so the feature is considered to be probably real.
Action: Check if a similar anomaly has been observed in a neighbouring drop or previously in the region. Downgrade data to Class 2 from the depth of the divergence.
Quality
Class: Class 2 from the depth of the divergence.
6.2R Reject Code N/A
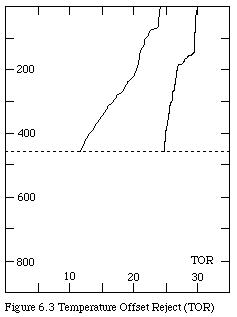
6.3 Temperature Offset Reject
Flag (TOR)
Description A
temperature offset is an unrealistic temperature displacement
observed over a large range of depths, which is not observed in
neighbouring drops and has not previously been observed in the
region.
6.3A Accept Code N/A
6.3R Reject Code TOR
Use: The TOR flag is used if an unrealistic temperature difference can not be confirmed by a neighbouring drop and there is limited evidence that eddies or fronts occur in the region.
Action: Determine if temperature differences have previously been observed in the region. Downgrade data and reject from the working archive from the depth of the offset.
Quality Class: Class 3 from the depth of the offset.
Bailey, R.J., H.E. Phillips, and G. Meyers,
1989: Relevance to TOGA of systematic XBT errors. Proceedings
of the Western Pacific International Meeting and Workshop on TOGA
COARE, Noumea, 1989. Edited by J. Picaut, R. Lukas, and T. Delcroix,
pp833.
Fedorov, K.N., 1983: Lecture Notes on Coastal
and Estuarine Studies; The Physical Nature and Structure of Oceanic
Fronts, Springer-Verlag, Berlin.
Levitus, S., 1982: Climatological Atlas of
the World Ocean; NOAA Professional Paper 13, 173pp.
McPhaden, M.J., 1985: Fine-Structure Variability
Observed in CTD Measurements from the Central Equatorial pacific,
Journal of Geophysical Research, Volume 90, Number C6, pages 11726-11740.
Nihoul, C.J. and B.M. Jamart, 1988: Small-Scale
Turbulence and Mixing in the Ocean, Elsevier Oceanography Series,
46.
Pickard, G.L. and J.W. Emery, 1990: Descriptive
Physical Oceanography: An Introduction, Pergamon Press.
Roemmich, D. and B. Cornuelle, 1987: Digitization
and calibration of the expendable bathythermograph. Deep-Sea Res.,
34, 299ñ307.
Tchernia, P., 1980: Descriptive Regional Oceanography,
Pergamon Marine Series Volume 3.
Acknowledgments
This 'cookbook' was completed
with the generous help of Edwina Tanner from the Australian Oceanographic
Data Centre (AODC) and Cher Page of the CSIRO Division of Oceanography.
Appendix A. Table of integer codes used to identify the Quality Control Flags
| Category | Accept Feature | Reject Feature | ||
| Character Code | Integer Code | Character Code | Integer Code | |
| Surface Spikes | CSA | 1 | ||
| Modulo 10 Spikes | MOA | 2 | MOR | -2 |
| Wire Break | WBR | -3 | ||
| Hit Bottom | HBA | 4 | HBR | -4 |
| PROTECHNO Leakage | PFA | 5 | PFR | -5 |
| Inversion | IVA | 6 | ||
| Nub | NUA | 7 | ||
| Fine Structure | STA | 8 | ||
| Wire Stretch | WSA | 9 | WSR | -9 |
| Leakage | LEA | 10 | LER | -10 |
| Bathy System Leakage (cusping) | CUA | 11 | CUR | -11 |
| High Frequency Noise | HFA | 12 | HFR | -12 |
| Insulation Penetration | IPA | 13 | IPR | -13 |
| Spikes | SPA | 14 | SPR | -14 |
| Bathy Systems Bowing | BOA | 15 | BOR | -15 |
| Surface Anomaly | SAA | 16 | ||
| Temperature Difference at Depth | TDA | 17 | ||
| Temperature Offset | TOR | -17 | ||
| Constant Temperature | CTA | 18 | CTR | -18 |
| No Trace | NTR | -19 | ||
| No Good | NGR | -20 | ||
| Test Probe | TPR | -21 | ||
| Repeat Drop | REA | 24 | RER | -24 |
| Sippican MK-9 processor error (sticking bit) | SBA | 27 | SBR | -27 |
| Other / Probe Error | OPA | 28 | OPR | -28 |
| Fine STructure | PSA | 29 | ||
| Sippican MK-9 Timing Delay | DRA | 30 | DRR | -30 |
| Probable Inversion | PIA | 31 | ||
| Eddy / Front | EFA | 32 | ||
| Position error | PEA | 33 | PER | -33 |
| Time / Date Error | TEA | 34 | TER | -34 |
| Duplicate Drop | DUA | 35 | DUR | -35 |
| Quality Control | QCA | 36 | ||
| Probable Step-like Fine Structure | PSA | 37 | ||