
Janet Sprintall, Scripps Institution of Oceanography, UCSD

|
|
Janet Sprintall, Scripps Institution of Oceanography, UCSD |
|
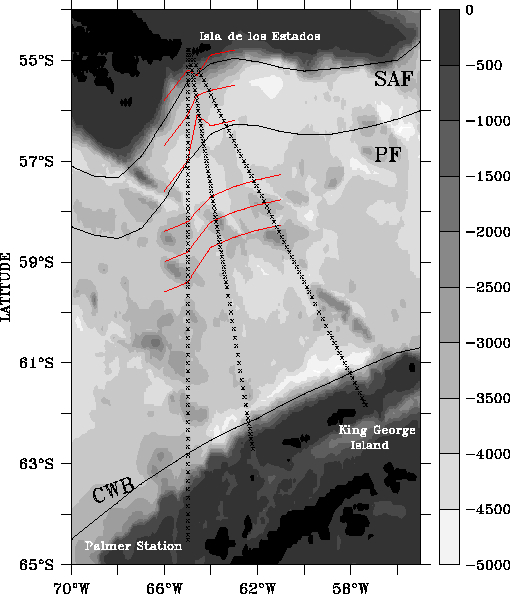 Figure 1. |
 Figure 2. |
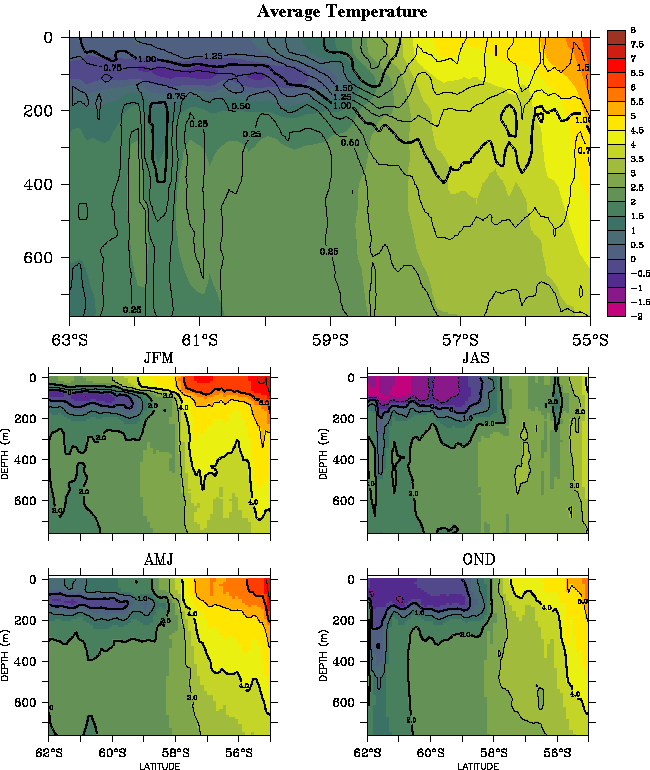 Figure 3. |
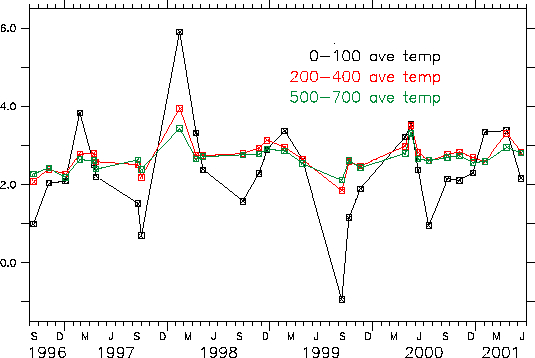 Figure 4. |
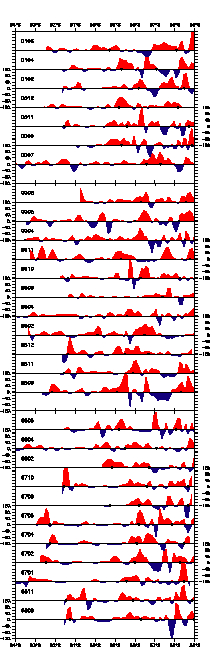 Figure 5. Figure 5 full size. |
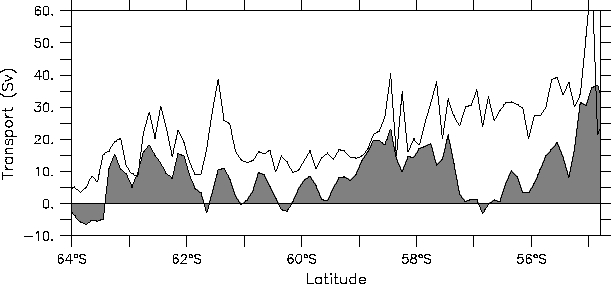 Figure 6. |
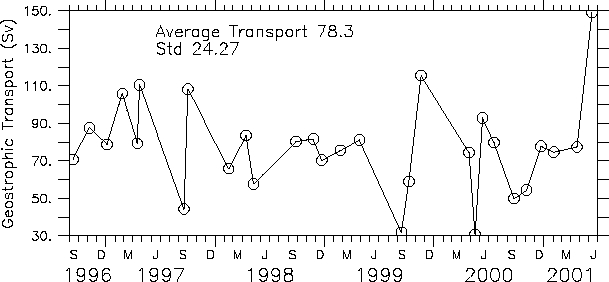 Figure 7. |
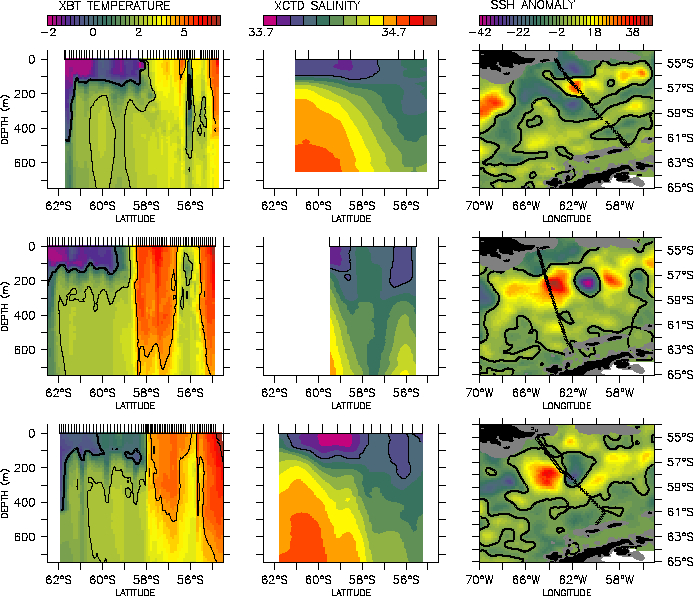 Figure 8. |
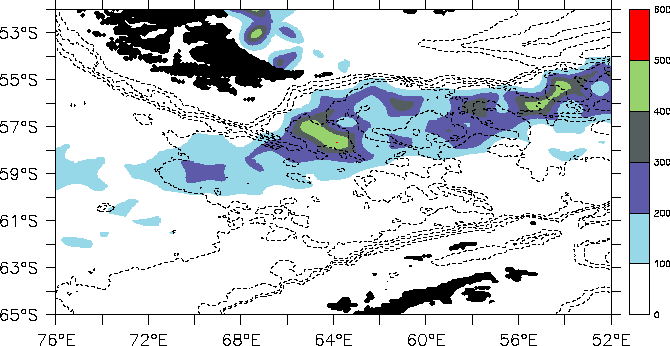 Figure 9. |
